

: “It seemed like one of those nights where our guys thought it was going to be easy… We know how it goes when that is the case”")


What is a Draft Pick Worth in a Trade for an Active Player?
This article is being co-posted on Maple Leafs Hot Stove as well as on my own site, www.originalsixanalytics.com. Find me @OrgSixAnalytics on twitter.
Many, many writers have touched on the concept of Draft Pick Value, myself included. Those who find it interesting are happy to talk about it for days, and those who don’t tend to steer clear pretty quickly. The one downfall of the work done to date is that almost all of it has focused on what draft picks are worth when traded for – you guessed it – other draft picks. In the spirit of the (now passed) trade deadline, I want to take a quick look at answering the following question:
How can we reasonably compare the value of a draft pick to the value of an active player?
To answer this, I will (i) introduce the concept of ‘absolute’ draft pick value, and (ii) go through an example, looking at the Leafs’ recent trade of Roman Polak and Nick Spaling to San Jose. My goal is not to conclude who ‘won’ the deal (I think that has already been decided), but rather to apply the concepts to a concrete example and give this analysis a bit more of a practical implication.
I want to make one caveat clear before comparing pick value and player value: This — and any other type of ‘valuation’ analysis — will always be an inexact approach and will not tell us the full picture. Teams don’t make decisions on deadline day because of abstract math; they make trades because they want to win, they have a specific spot to fill, and they believe that particular trade is the best way to fill it. The market dynamics of the trade deadline also have a huge impact in how trades go. This year, demand exceeded supply for defensemen, driving up the price of players like Roman Polak. Similarly, no one was really looking for a rental goalie, so James Reimer fetched far less than he is probably worth. As such, keep in mind this type of analysis should always be considered in conjunction with a wide range of other quantitative and qualitative factors.
(Relative) Draft Pick Value
As mentioned, previous work has largely focused on relative draft pick value – that is, what a pick is worth in a deal for other picks. These draft pick value charts often end up quantifying picks/future players in terms of some currency or ’unit’ that is hard to assign meaning to out of context. Relative draft pick value is most useful on the day of the draft, when many pick-for-pick trades are made and we know the exact selection number a pick relates to (as opposed to only knowing the round). However, in order to compare between draft picks and players, we need to compare players on the same metric — one that addresses the concept of absolute draft pick value.
Absolute Draft Pick Value
In his recent piece, Stephen Burtch took another big step forward in this area by laying out a number of simple and clear metrics in a concise table to illustrate some proxies for draft pick value. Here is his table:
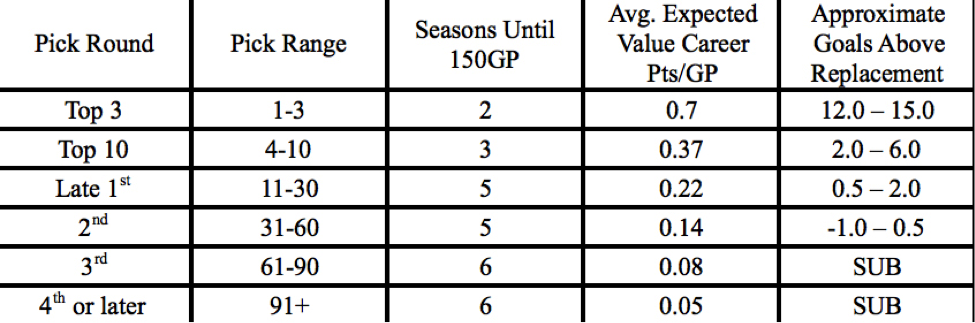
I am a big fan of this table. Not only does Burtch introduce an absolute value metric for players (Expected Pts/GP), but he shows how long it takes for those players to become real contributors (Seasons until 150GP). He also connects it all to the Goals Above Replacement metric – another thing I am a big fan of. Later on in his article, Burtch also essentially splits teams into ‘buyers and sellers’ – a very useful lens through which to view the market dynamics on deadline day (e.g. availability or scarcity of particular assets, driving demand and price).
Although this chart is a great start for absolute pick value, I think we can go one step further. Having analyzed Expected Pts/GP for draft picks myself, there are two things I want to point out. The first, which we’re all aware of, is that it differs significantly by forwards and defensemen (Burtch no doubt recognizes this; he just wasn’t showing that level of detail in his table). Secondly, it has a survivorship bias – that is, over time, only the strongest players remain in the league and continue scoring points, thus driving up the averages over time. Thus, Pts/GP does not appropriately account for the probability that a player stays in the league at all.
Player Lifetime Production
While I recommend using as many value-metrics as possible to establish a well-rounded view, one of my own favourites for absolute pick value is Lifetime Production, calculated as the expected average cumulative points per player (e.g. total career points). This metric implicitly adjusts for players who never make it into the league at all, as the denominator in the equation is total players drafted rather than total games played. See below for two of my previous charts, showing this metric for both forwards and defensemen.
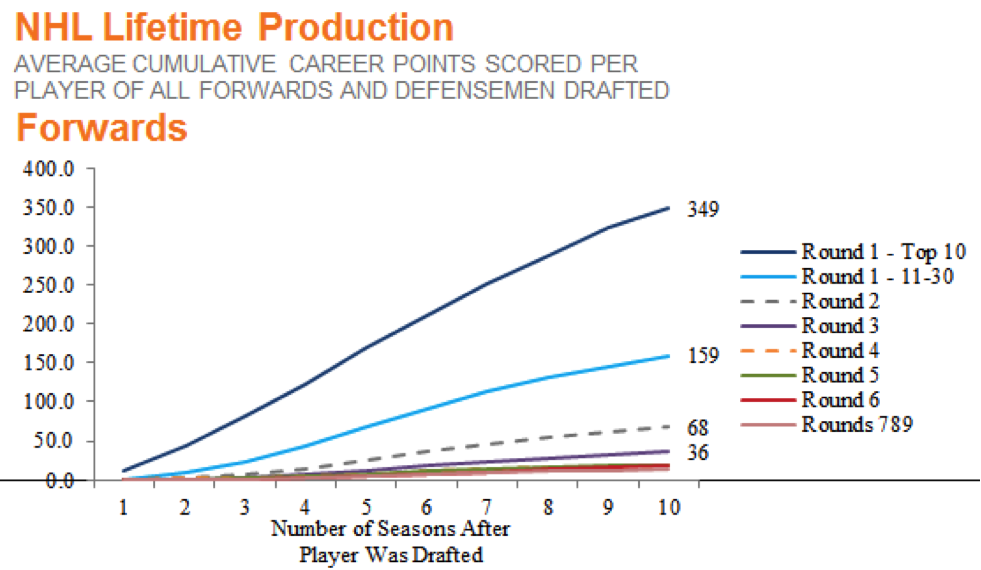
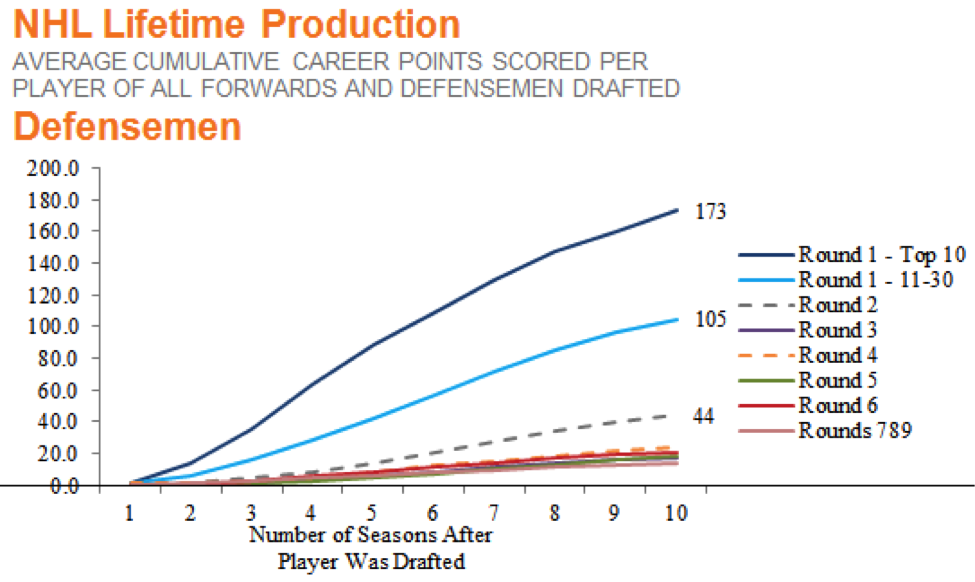
(Note: The chart sample is all players drafted between 2000 and 2004, and their subsequent playing histories over each of their first ten seasons in the league).
Although this data doesn’t separate the top three picks overall, who deserve their own echelon, you can still see some clear results:
- Over their first ten seasons in the league, a top-10 overall pick should be considered to be worth ~170 total points if a defenseman is selected, or ~350 points if a forward is selected.
I - Depending on how soon that player really begins to contribute, (e.g. many players only are NHL regulars for 5-8 of their first ten seasons), top-10 overall defensemen come out as ~20-30 point per season players, and top-10 forwards come out as ~40-60 point per season players.
Now, this metric is also not perfect. It works well when used far in advance of the draft, when it is unclear what overall selection number a pick relates to. However, it can be a pretty high level approach when a team knows it is holding the 33rd overall pick, for example, which could be treated much the same as a late first round pick. Many will also rightfully point out that these are averages with huge distributions in results. In all rounds, there will be many players who will have 500-600+ points over these 10 seasons, and many who will have less than 10. As a result, these averages/expected values will only ever be one piece of the puzzle.
Case Study: TML trade Polak/Spaling for two second round picks
Lastly, I will try to illustrate this concept a little more clearly by looking at the Leafs’ recent trade of Polak and Spaling to San Jose in return for two second round picks. Here are the assets that changed hands in the deal:
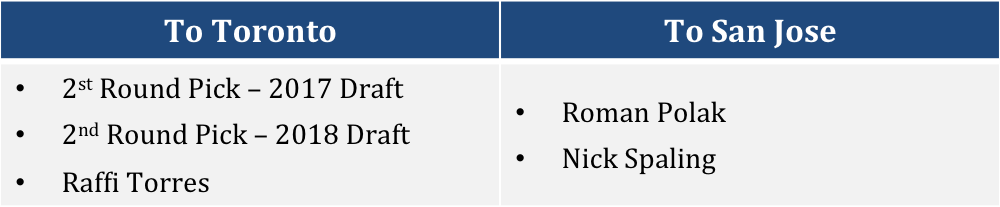
Now, Raffi Torres was more of a cap offload by San Jose, who the Leafs have let remain at San Jose’s AHL affiliate (he’s also not playing for the rest of the season). As a result, let’s exclude him from the comparison. For simplicity’s sake, to stack up the remainder of the trade I have assumed TML uses the two picks to select one forward and one defenseman. Further, based on both Burtch’s and my charts above, second round picks only really begin to meaningfully contribute around their fifth season after being drafted. As such, you should consider the ‘lifetime production’ for these picks to be over approximately five or six active NHL seasons.
The table below summarizes the career points we can expect from these picks versus what could be expected from Roman Polak / Nick Spaling over each of their next five seasons.
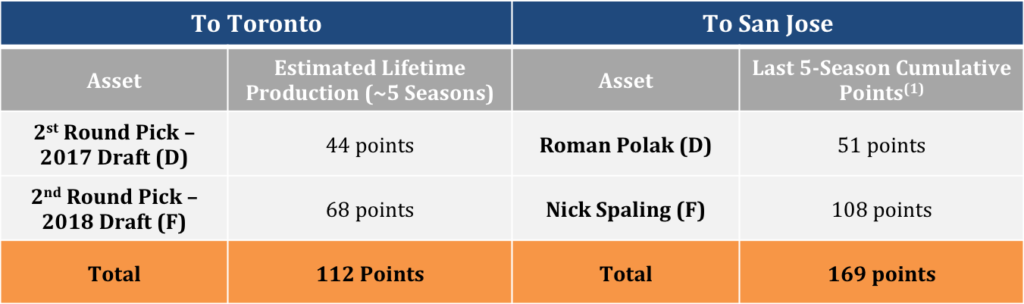
In order to try to show this on an apples-to-apples basis, I have assigned Polak/Spaling the value of their cumulative points over their last five seasons. Now, this is not exactly scientific, and should not be treated as a ‘trade-defining’ result. However, the chart does show an interesting finding: based on what can reasonably be expected from these picks over ~10 years after being drafted (which includes adjusting for their likelihood to succeed in the league at all), they will not necessarily be as productive as Polak/Spaling will be over each of their next five seasons, in the aggregate.
However, that is not the full story of course. Polak and Spaling are shown here in a somewhat generous view of what you could expect out of them for the next ~5 seasons. It does not discount their performance at all for declining with age, nor does it consider their moderate cap hits, as 27 and 29 year old players. Given that they are both Unrestricted Free Agents (UFAs) at the end of this year, San Jose may only actually realize the value of ‘one’ of the next five seasons from these two players. The table below adjusts this data to be shown on a per-season basis, rather than in aggregate, simply by dividing the last chart by five expected seasons:
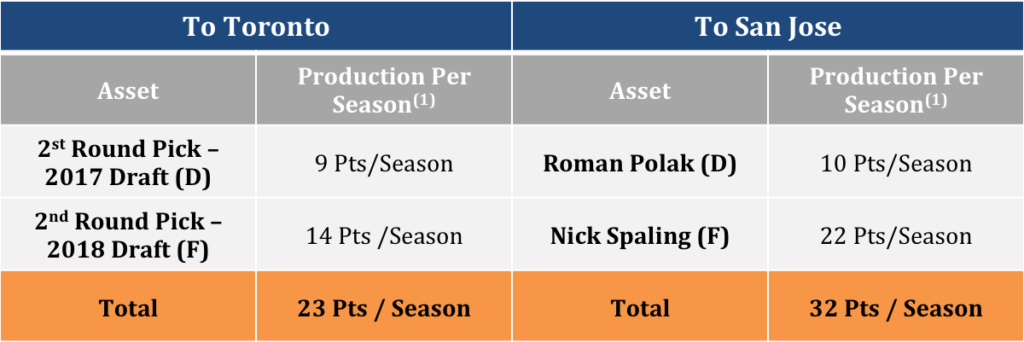
Looked at differently, although San Jose got a total of 32 ‘Pts/Season’ worth of production, the Sharks only have certainty that they acquired the tail end of the 2015-16 season (e.g. ~20 games) before these two players could walk away and sign with any team in the league.
At the same time, Toronto ‘only’ acquired 23 Pts/Season, but this will be spread out over five productive years. These will also be the prime years of those players’ careers, where their value is the highest, due to being a low cap hit while on Entry-level/UFA deals; Toronto has the players’ exclusive rights while they develop. Last, as has been touched on in the past, ideally Mark Hunter and company can actually increase the probability of turning these picks into higher-calibre players than average, given his and his team’s strong network and scouting capabilities.
A Note on Time Value
One final note before concluding: It is also worth pointing out that, given these picks are for 2017 and 2018, they are inherently less valuable than a pick for this upcoming draft, and I suspect that is a key reason that San Jose was willing to make this trade. Even rebuilding teams want to rebuild now, not 2-3 years from now.
To illustrate this concept, ask yourself if a second round draft pick in 2022 is worth the same as one in 2016? Standing here in 2016, it is not. The same logic applies to 2017 and 2018 picks, although to a lesser extent. Fortunately for Toronto, the Leafs have so many picks in 2016 that arguably they were looking for picks in later years in the first place. However, this willingness to accept a later date (plus the lack of supply of rental defensemen this year) likely helped the Leafs increase their yield in this trade significantly. For anyone interested, this ‘time value’ concept is directly borrowed from the world of corporate finance, where ‘discounting future cash flows’ (e.g. player production) is the foundation of assigning a value to a business.
Conclusion
To wrap up, I have hopefully heavily caveated that this analysis should not be considered scientific, the best, or even the only way to compare the value of draft picks to active players. What this hopefully does provide us, though, are some useful heuristics (rules of thumb) to keep in mind for future deals, which can be combined with all of the other methods available at our disposal to evaluate transactions. As a result, the next time you see a team toss two around first round picks (or equivalent players) for a long-term Phil Kessel-type player, or an short-term rental of an Andrew Ladd-type player, hopefully you walk away thinking about just how many hundreds of future points they are giving up down the road.


: “It seemed like one of those nights where our guys thought it was going to be easy… We know how it goes when that is the case”")

